ArcGIS StoryMaps

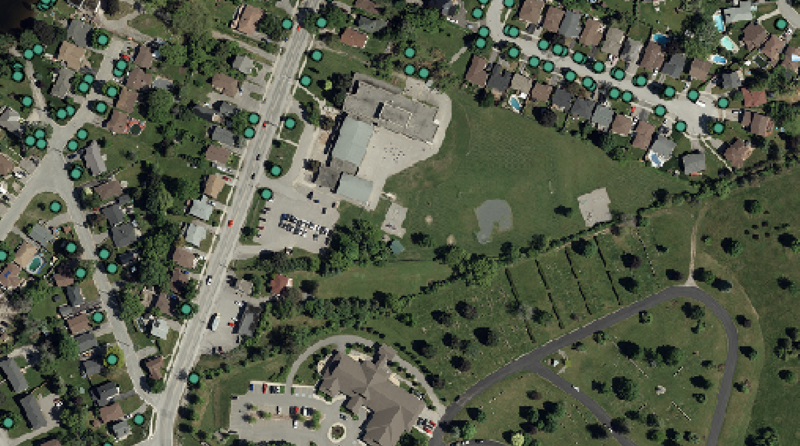
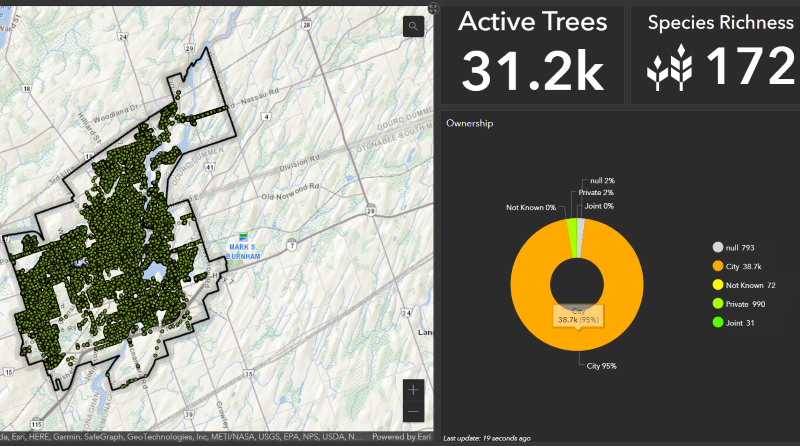
Creating Engaging Tree Data Visualizations
StoryMapCapture

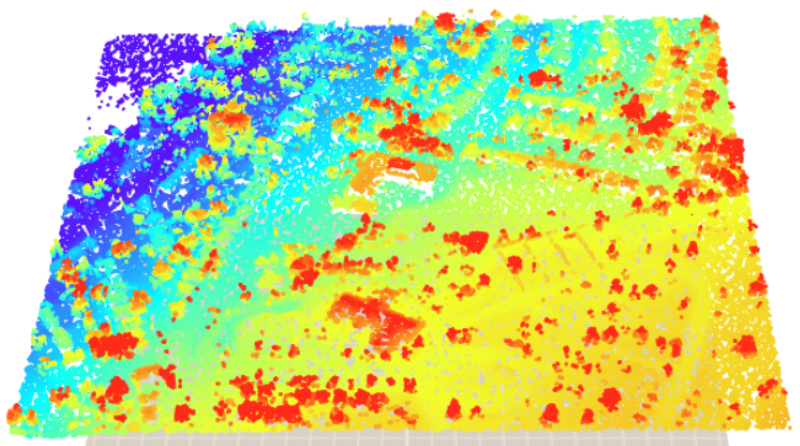
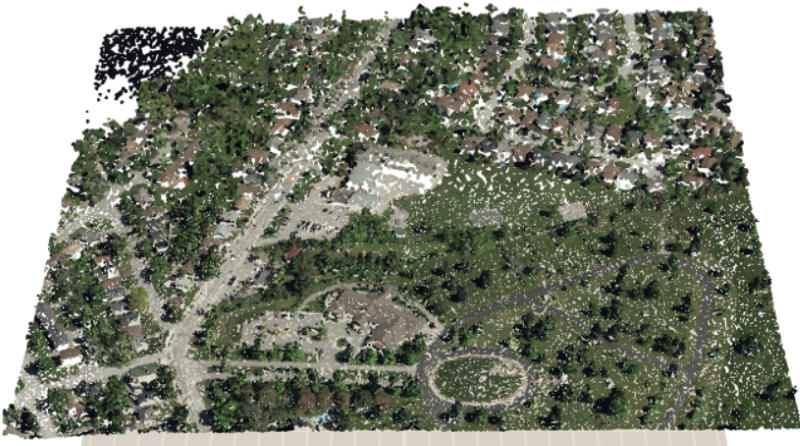
ArcGIS StoryMaps is a container that allows the creator to weave together a story and easily integrate web content and products built within ArcGIS Online (AGOL). It can be an ideal platform for making content more accessible and interesting to those without specialized knowledge or expertise. Although the ideal of pairing 3D realistic trees with the point data unfortunately was not achieved, the page provides some interesting ways of visualizing tree-related data, as well as putting the data into context with the addition of relevant local articles and educational links.

Orthoimagery
StoryMapCapture

First, we have some high-resolution (5cm!) orthoimagery (only on a single tile due to time/data processing constraints) with points on top with a simplified attribute table that provides only the data that might be of interest, such as location, species, notes, and physical condition. Users can easily explore the map based on their own address or current location, which is made possible by simply selecting these options. No coding or configuration required!

Dashboard
StoryMapCapture

Embedding previously created AGOL content such as a dashboard is a breeze in StoryMaps. This provides a summary of some interesting information such as total number of species, and a graph of ownership of the full street tree inventory. This allows viewers to view summary statistics in a more digestible and aesthetically pleasing manner.

LiDAR point cloud visualizations
StoryMapCapture
StoryMapCapture

The next section focuses on two LiDAR point cloud visualizations, one which provides symbology by elevation and the second, which takes the colours from the orthoimagery and applies those colours to the LiDAR point cloud. Although visually imperfect and incomplete, it is visually intriguing and may cause some viewers to do more research or at the very least be able to understand the importance and utility of LiDAR data.