ArcGIS Map SDK for JavaScript

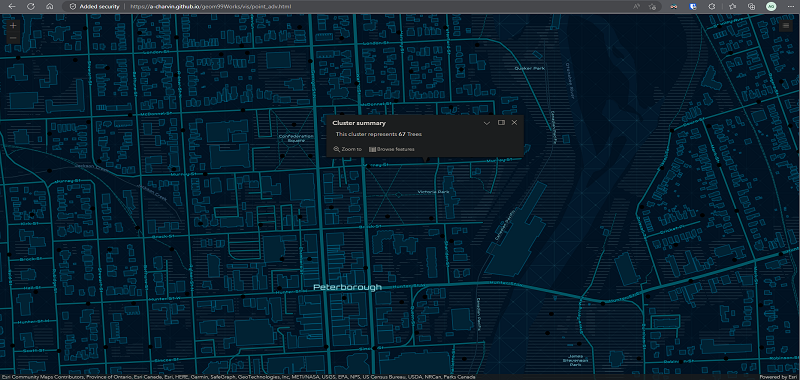
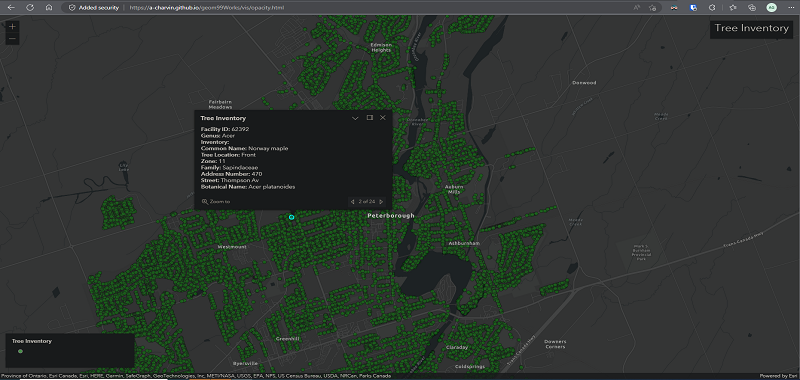
Visualization through code
StoryMapCapture

ArcGIS Map SDK for JavaScript is a powerful tool for creating data visualizations that leverage location-based data. It provides developers with a range of capabilities and tools to create dynamic, interactive maps and web applications. With a wealth of features and customization options, the SDK can be used to build applications for a range of industries and use cases, from logistics and transportation to environmental and social analysis. Whether you are a seasoned developer or a newcomer to the field, the ArcGIS Map SDK for JavaScript can help you create engaging and informative data visualizations that help you better understand and communicate spatial information.

Clustering
StoryMapCapture

Clustering is a technique commonly used in data visualization to group data points that are spatially close to each other. It is particularly useful when working with large datasets, as it allows for the identification of patterns and trends that may not be immediately apparent when looking at individual data points. By aggregating data into clusters, patterns and relationships can be more easily observed, which can aid in decision-making and problem-solving.

In addition to helping make sense of large datasets, clustering can also be used to enhance the visual appeal of a data visualization. By grouping similar data points together, the resulting visualization can be less cluttered and more aesthetically pleasing. This can help to make the visualization more engaging and effective in communicating insights to its audience.

Point Visualization
StoryMapCapture

The easiest form of data visualization Visualizing data through points and popup information is a popular and effective technique in data visualization, particularly in the realm of spatial data. This technique involves plotting data points on a map or other spatial representation, with each point representing a single data entry. When a user clicks or hovers over a point, a popup appears displaying more detailed information about that data point, such as its value, location, or other relevant attributes.

Failures & Conclusion
StoryMapCapture
StoryMapCapture

Failure is something which we have to except, accept and try to overcome. Multiple methods of visualisation where tried, there have been quite a few failures in that attempt, some of them failed at execution, Some failed at runtime, some had issues in their code which prevented them from ever showing up. All of which require several trouble shooting and fixing steps, which for the time being due to limited time constraints are on hold.

In Conclusion : ArcGIS Map SDK for JavaScript can be a powerful tool for creating data visualizations, it may not always be the best option. It can require a significant amount of technical expertise and knowledge to use effectively, and may not be as intuitive or user-friendly as other data visualization platforms. Additionally, it may not always provide the level of customization or flexibility that some users may require for their specific needs.